
Console
Everything your app logs, on the device, plus a prompt that runs JavaScript and answers.
The Console tab mirrors everything your app logs, on the device. Warnings sit on a yellow row and errors on a red one, and the toolbar keeps a running count of each — so you can see at a glance whether anything went wrong while you were not looking.
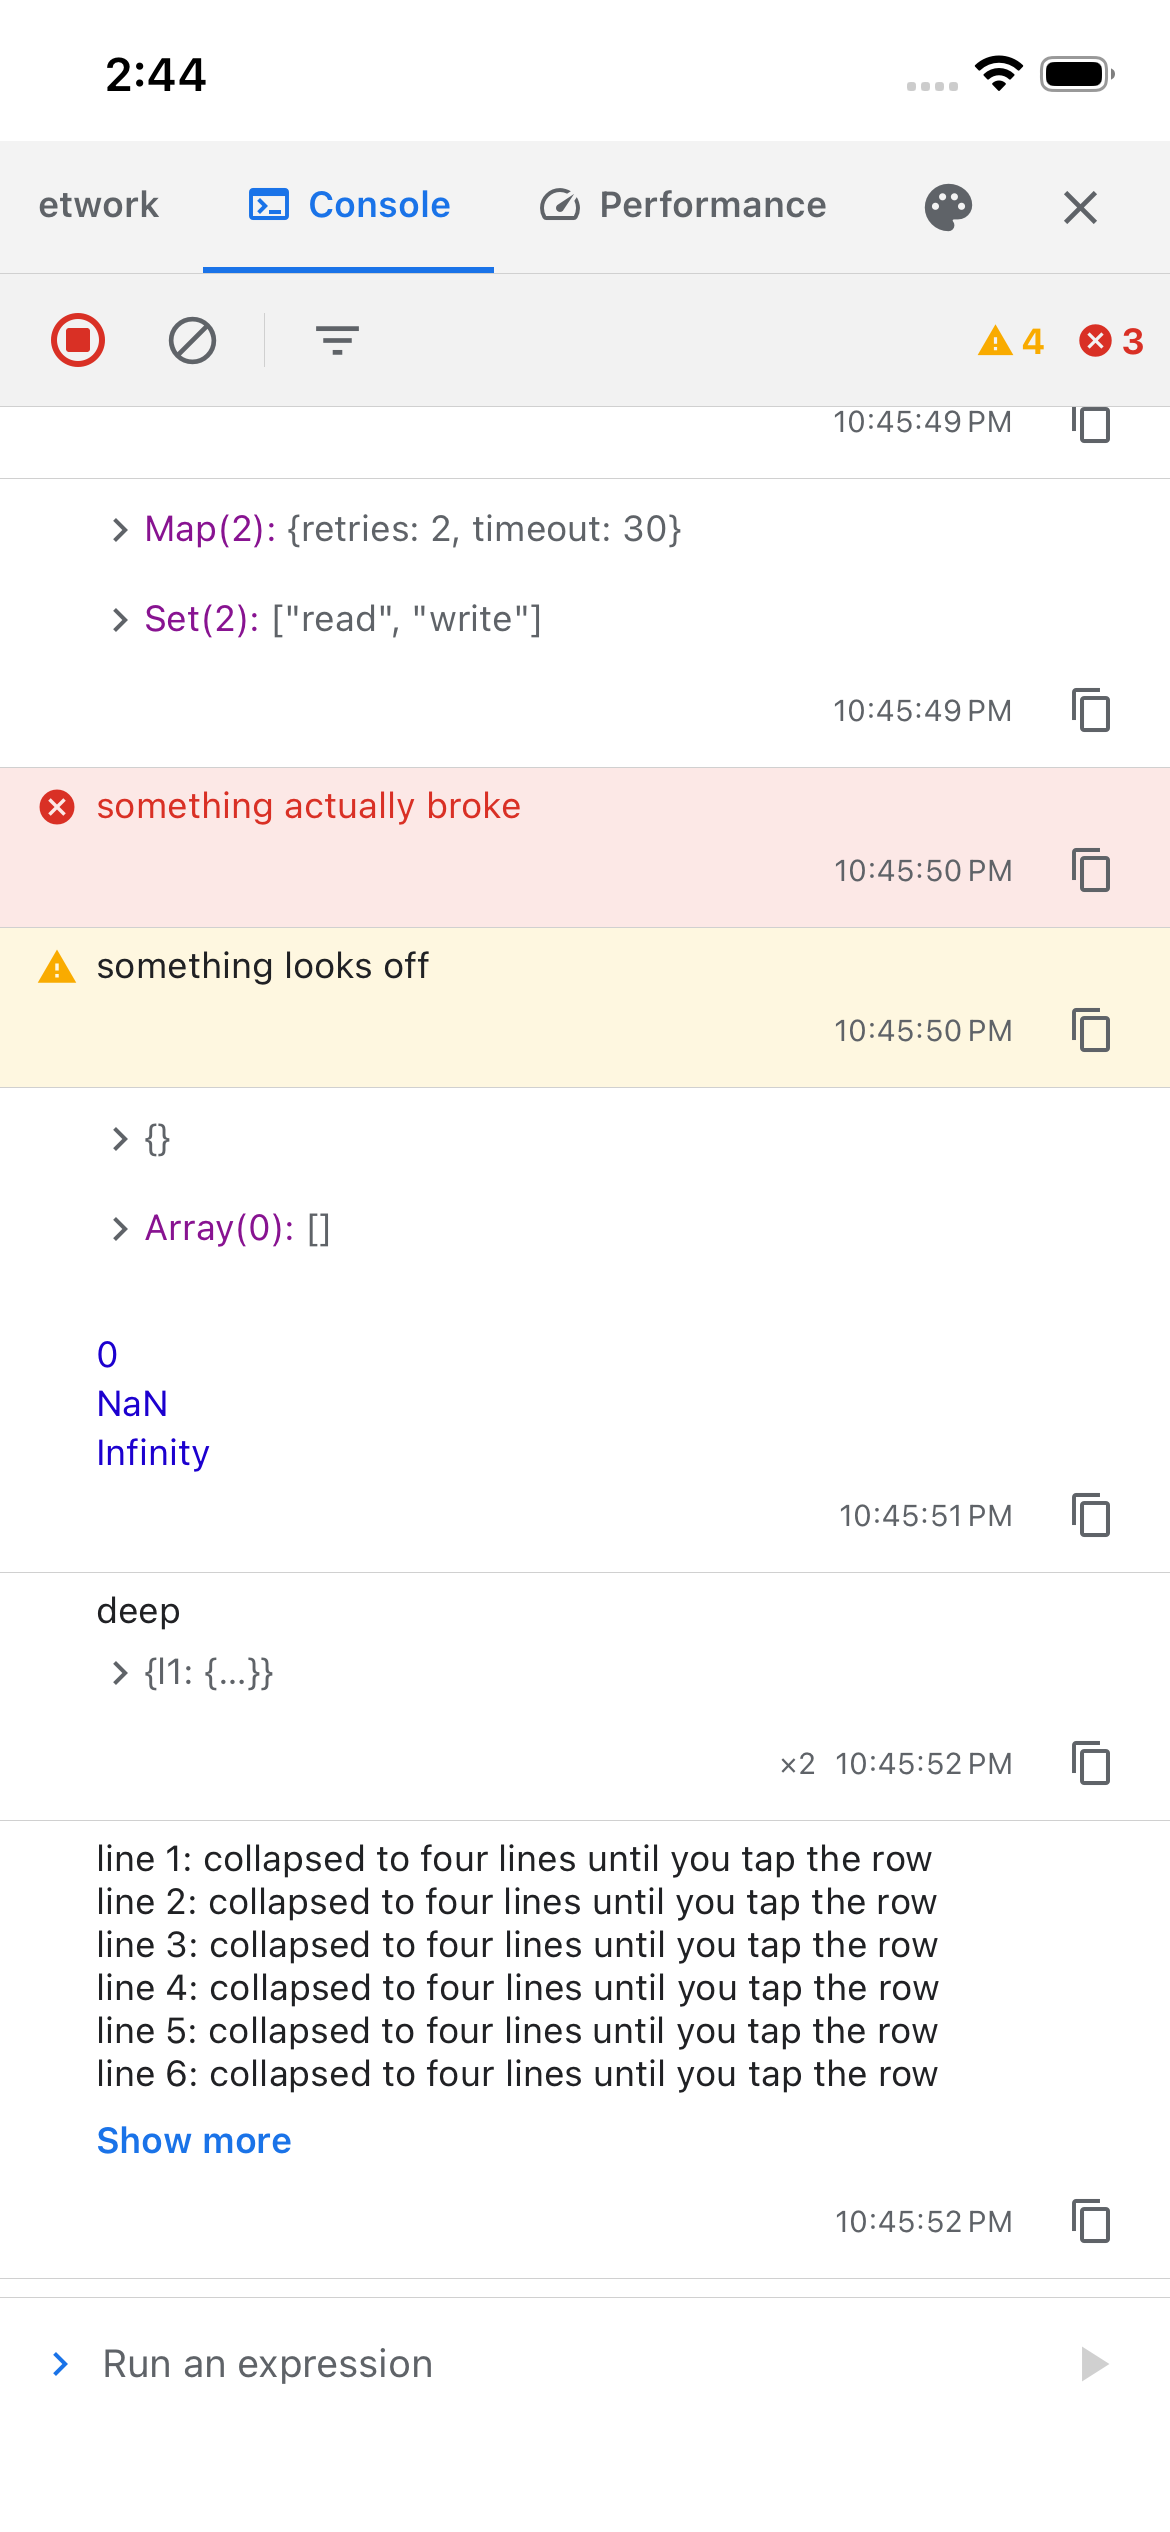
- Each thing you logged gets its own line, so a message and the object next to it do not run together. Objects and arrays start collapsed. Tap to open them up, level by level.
- Errors show their message on the row and the full stack when you tap it.
- The same message logged over and over becomes one row with a count, so a chatty screen does not bury everything else.
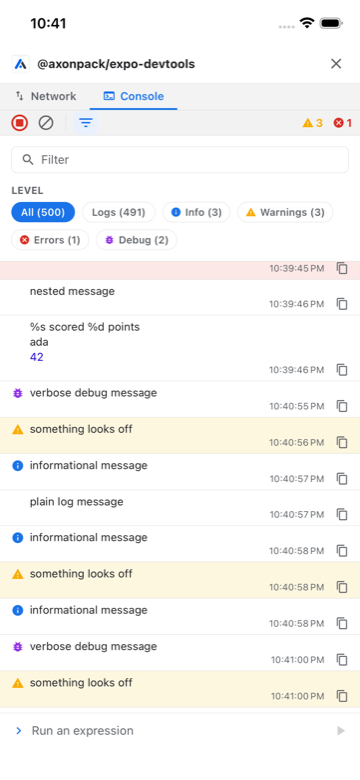
- Filter by level (each chip carries a live count) or by source, or search the text of every message — with match case, whole word and regex, and every match highlighted where it sits.
- The newest output stays in view automatically, and stops following if you scroll back to read something, with a button to jump back to the newest.
- Copy any line with one tap.
Running an expression
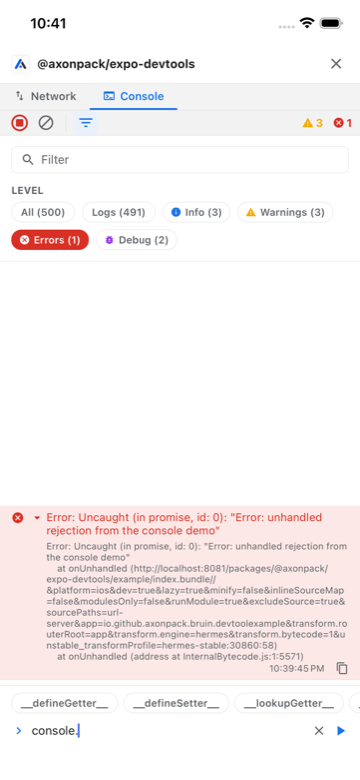
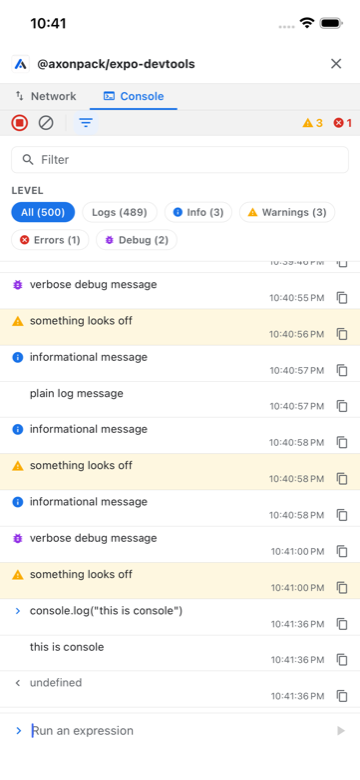
The > prompt at the bottom runs JavaScript on the device and shows you what came back. Your typed
command appears with a ›, the answer with a ‹, and objects come back as the same explorable tree.
Something that returns a promise shows as pending and fills in when it settles, so
fetch(...).then((r) => r.json()) works as you would expect.
- Names are suggested as you type, including the members of whatever object you are inside.
- Tap any command you ran earlier to load it straight back into the prompt.
- Two built-in helpers reach your app's own code in a development build:
$modules('auth')lists the files that are loaded, and$m('src/stores/auth')hands you one of them.
Reaching your own objects
Your app's files are bundled as private closures, so nothing can reach an imported name on its own the
way a browser console reaches a page's variables. Anything you want to poke at by name, hand over in
context:
createDevtoolsClient({
  console: { context: { store, queryClient } },
});
It is also the only thing that works in a release build, where the module list the two helpers above read is not available.
The prompt is on by default, in every build
console.repl defaults to true, and it is not gated on __DEV__. Once init() has run, the
prompt is there — including in a release build, where it will run whatever is typed into it. Guard
your init() call (see Leaving it in production), or turn the prompt off
explicitly with console: { repl: false }.
Limits
- The list holds the 500 most recent rows.
- Only
console.log,.info,.warn,.errorand.debugare mirrored. - The prompt cannot reach bundled module names on its own.
console.contextis the supported route.