
Debug
Tools that break the app on purpose, so the numbers on the other tabs can be trusted.
The Debug tab breaks the app on purpose, so the numbers on the other tabs can be trusted. It blocks or crashes a thread on demand, which is the only way to see what a real freeze does to the readings.
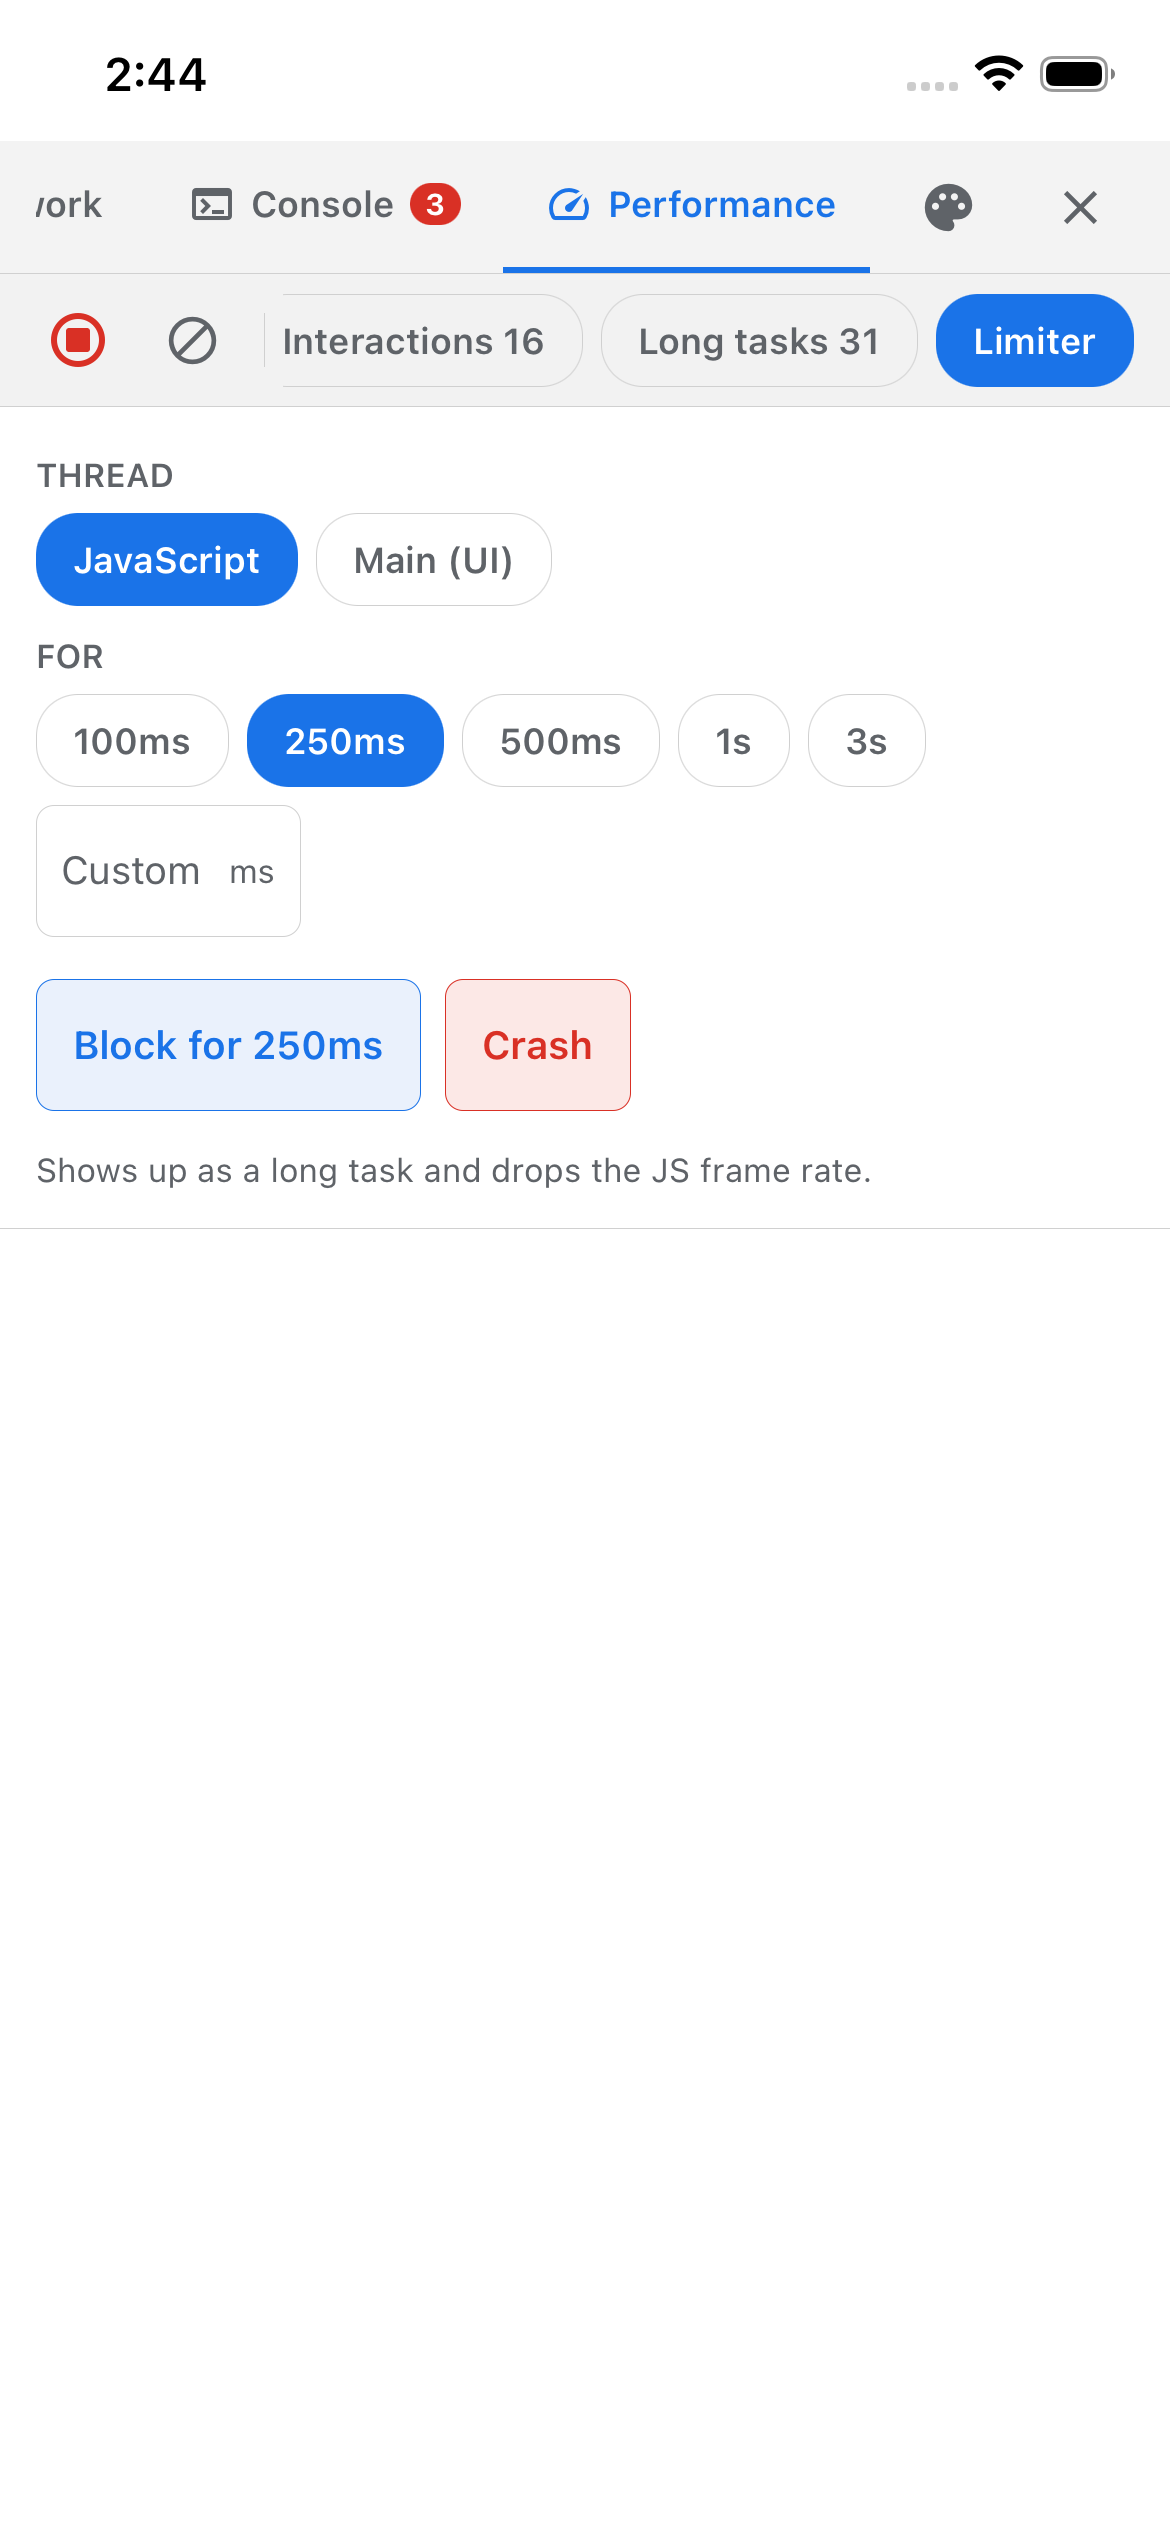
Blocking a thread
Pick a thread, pick a duration (100 ms to 3 s, or type your own), and block it:
- JavaScript — shows up as a long task and drops the FPS reading. Works everywhere.
- Main (UI) — freezes what you see and touch while the JS numbers stay perfectly healthy. That gap is the blind spot the frame-rate card warns about, and this is how you see it for yourself. Needs a development build.
Crashing a thread
There is also a Crash button for either thread, which takes two taps: the first arms it, the second does it.
The two are not the same event, and the difference is worth seeing once. A JS throw is caught and reported before you let go of the button, while a main-thread crash ends the process and is read back off disk at the next launch. Either way the report is waiting on the Crashes tab.
These buttons are not gated on __DEV__ or on init()
They call straight into the native module, so they work whenever the panel is on screen, whether or
not .init() ran. Guarding the <DevtoolsOverlay /> mount is what keeps them out of a release —
see Leaving it in production.
There is no record button and nothing to clear, so the tab carries no toolbar.