
Performance
Frame rate, memory, startup and the moments the app froze — measured on the device.
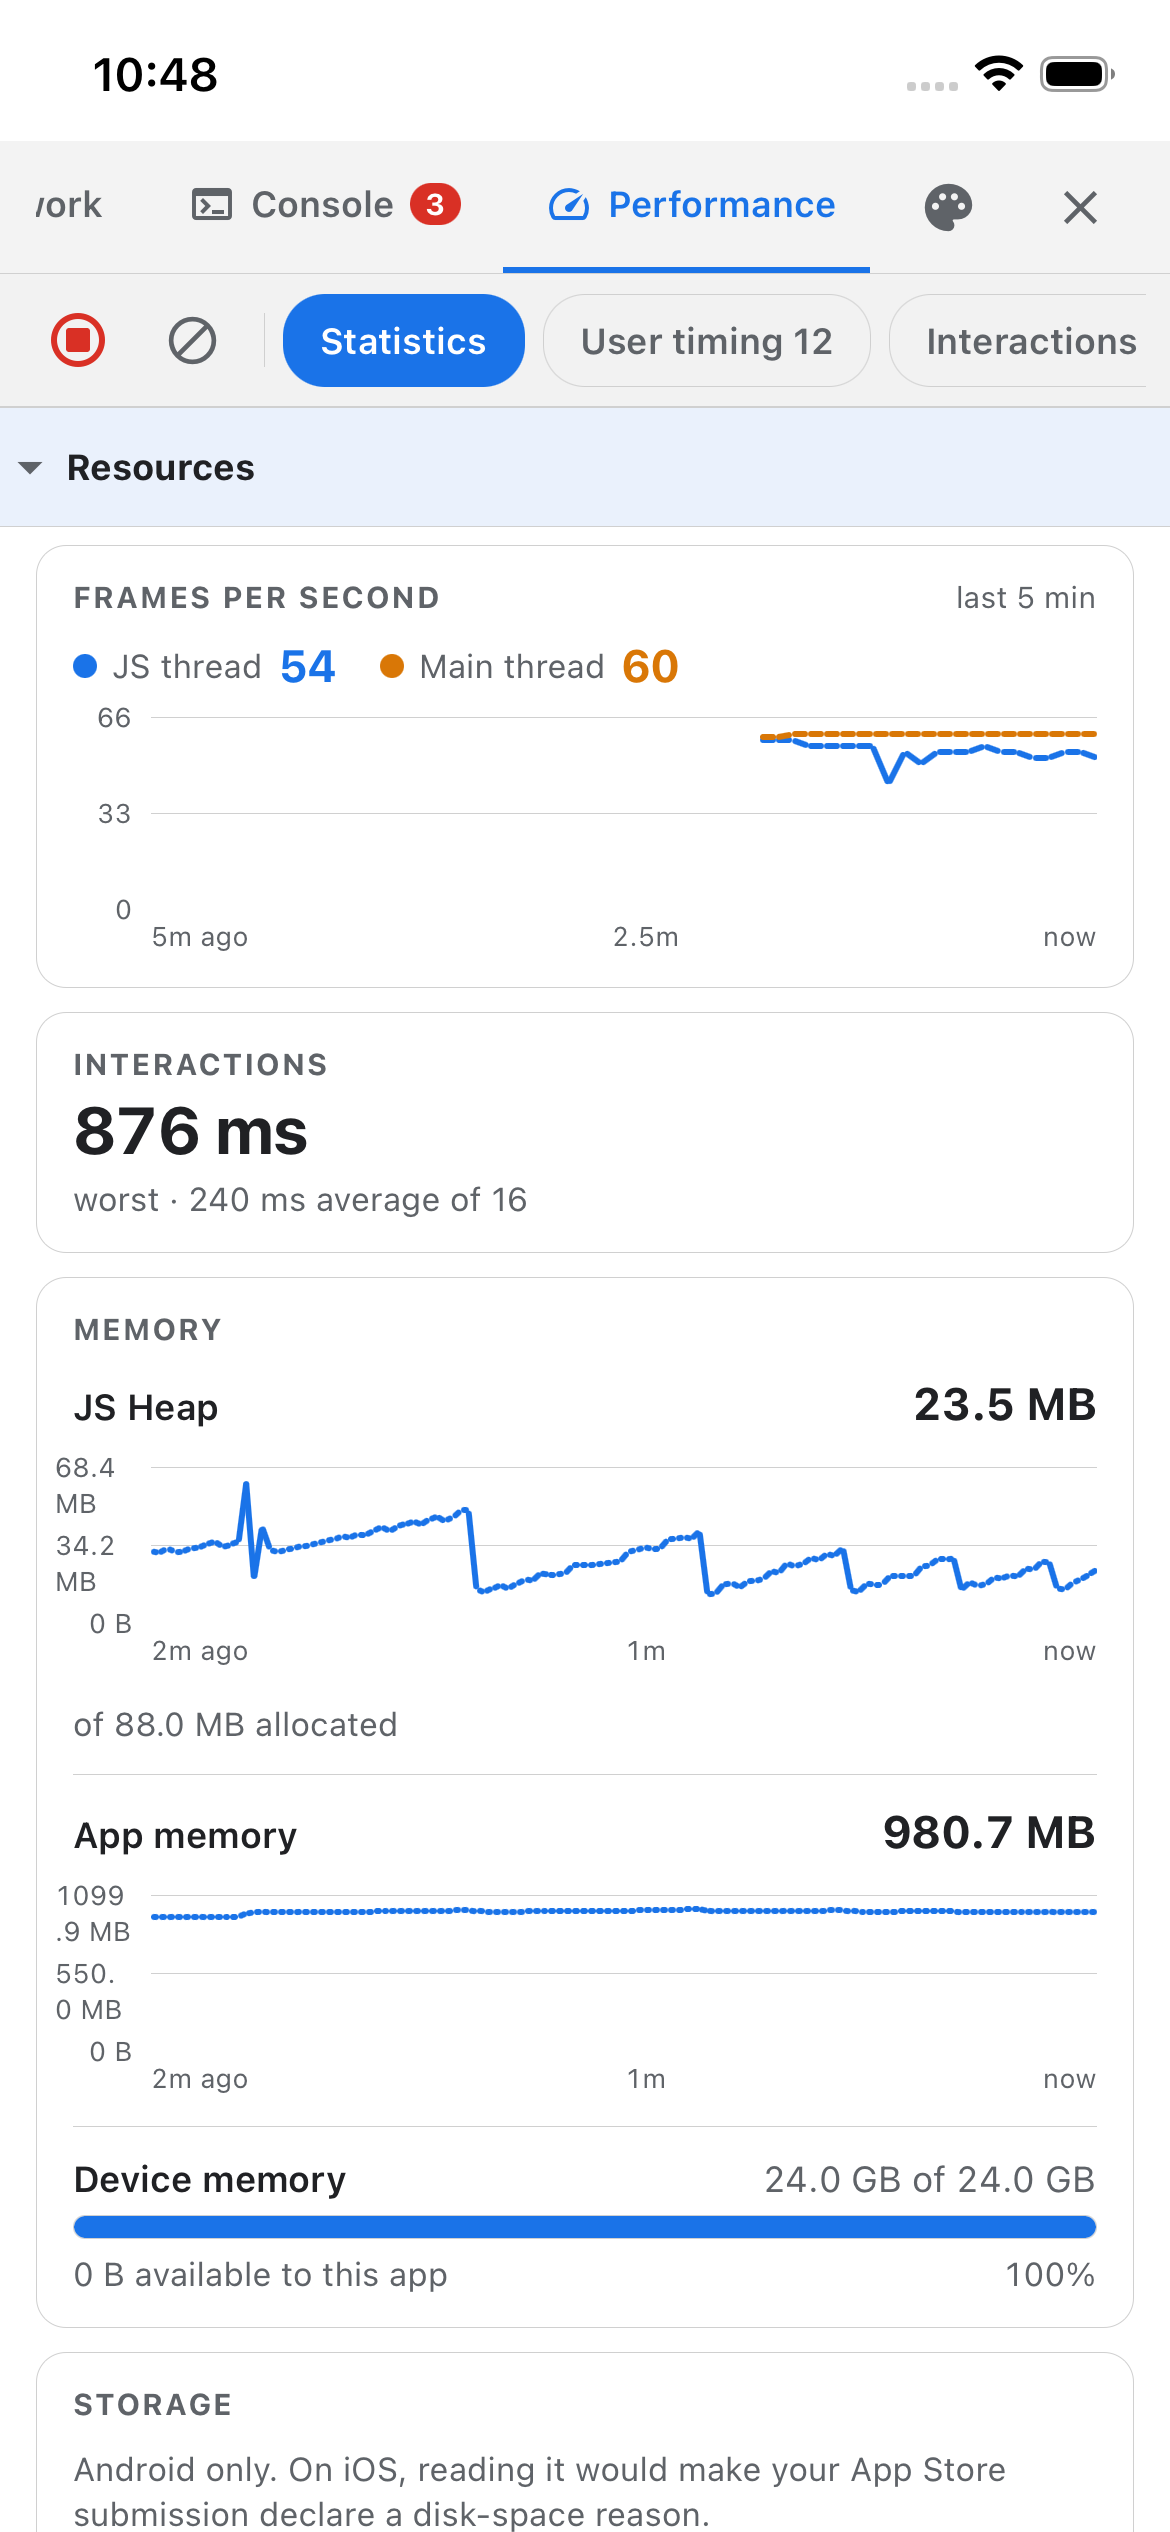
The Performance tab measures frame rate, memory and startup on the device itself — no desktop profiler, no cable. The toolbar carries the record and clear buttons, then a chip per section. Only the section you are looking at is mounted, so the charts are not re-rendering behind a list you are reading.
This tab starts paused
Unlike the other two recording tabs, this one starts paused, because measuring is not free. While it is paused nothing is measured at all: the instrumentation detaches rather than running and discarding, so leaving it off costs nothing. Pressing record attaches everything fresh and picks up whatever the platform still has buffered.
Statistics
- Frame rate — the JS thread from a frame-delta loop, and the main thread from a native display-link counter, on one chart. The gap between them is the reading that matters: a healthy JS line above a collapsed main-thread line is an app that feels frozen while every JS metric says it is fine. The main-thread figure needs a development build.
- JS heap — how much the JavaScript engine has allocated, with a sparkline of the last two minutes, so you can watch it climb while you use the app.
- App memory — the whole process footprint, which is what the OS holds against you and what a user means by "memory". Routinely several times the JS heap, so the two are stacked as separate plots rather than letting one stand in for the other. Needs a development build.
- Device memory — how much RAM the phone has, and how much this app may still allocate, as a meter directly under the app's own footprint. On Android the available side is system-wide free memory; on iOS it is what the process can still claim before being killed. Needs a development build.
- Storage — total, used and free space on the data partition. Android only, for the App Store reason below. Needs a development build.
- Startup — process start to first render, split into native startup, bundle eval, app setup and first render. Measured by this package's own native module, so it works even where the platform's own markers are all null. Phase boundaries are this package's load points, not platform milestones, so they shift a little with import order. If the platform does report its markers, they are shown underneath as a second set.
User timing
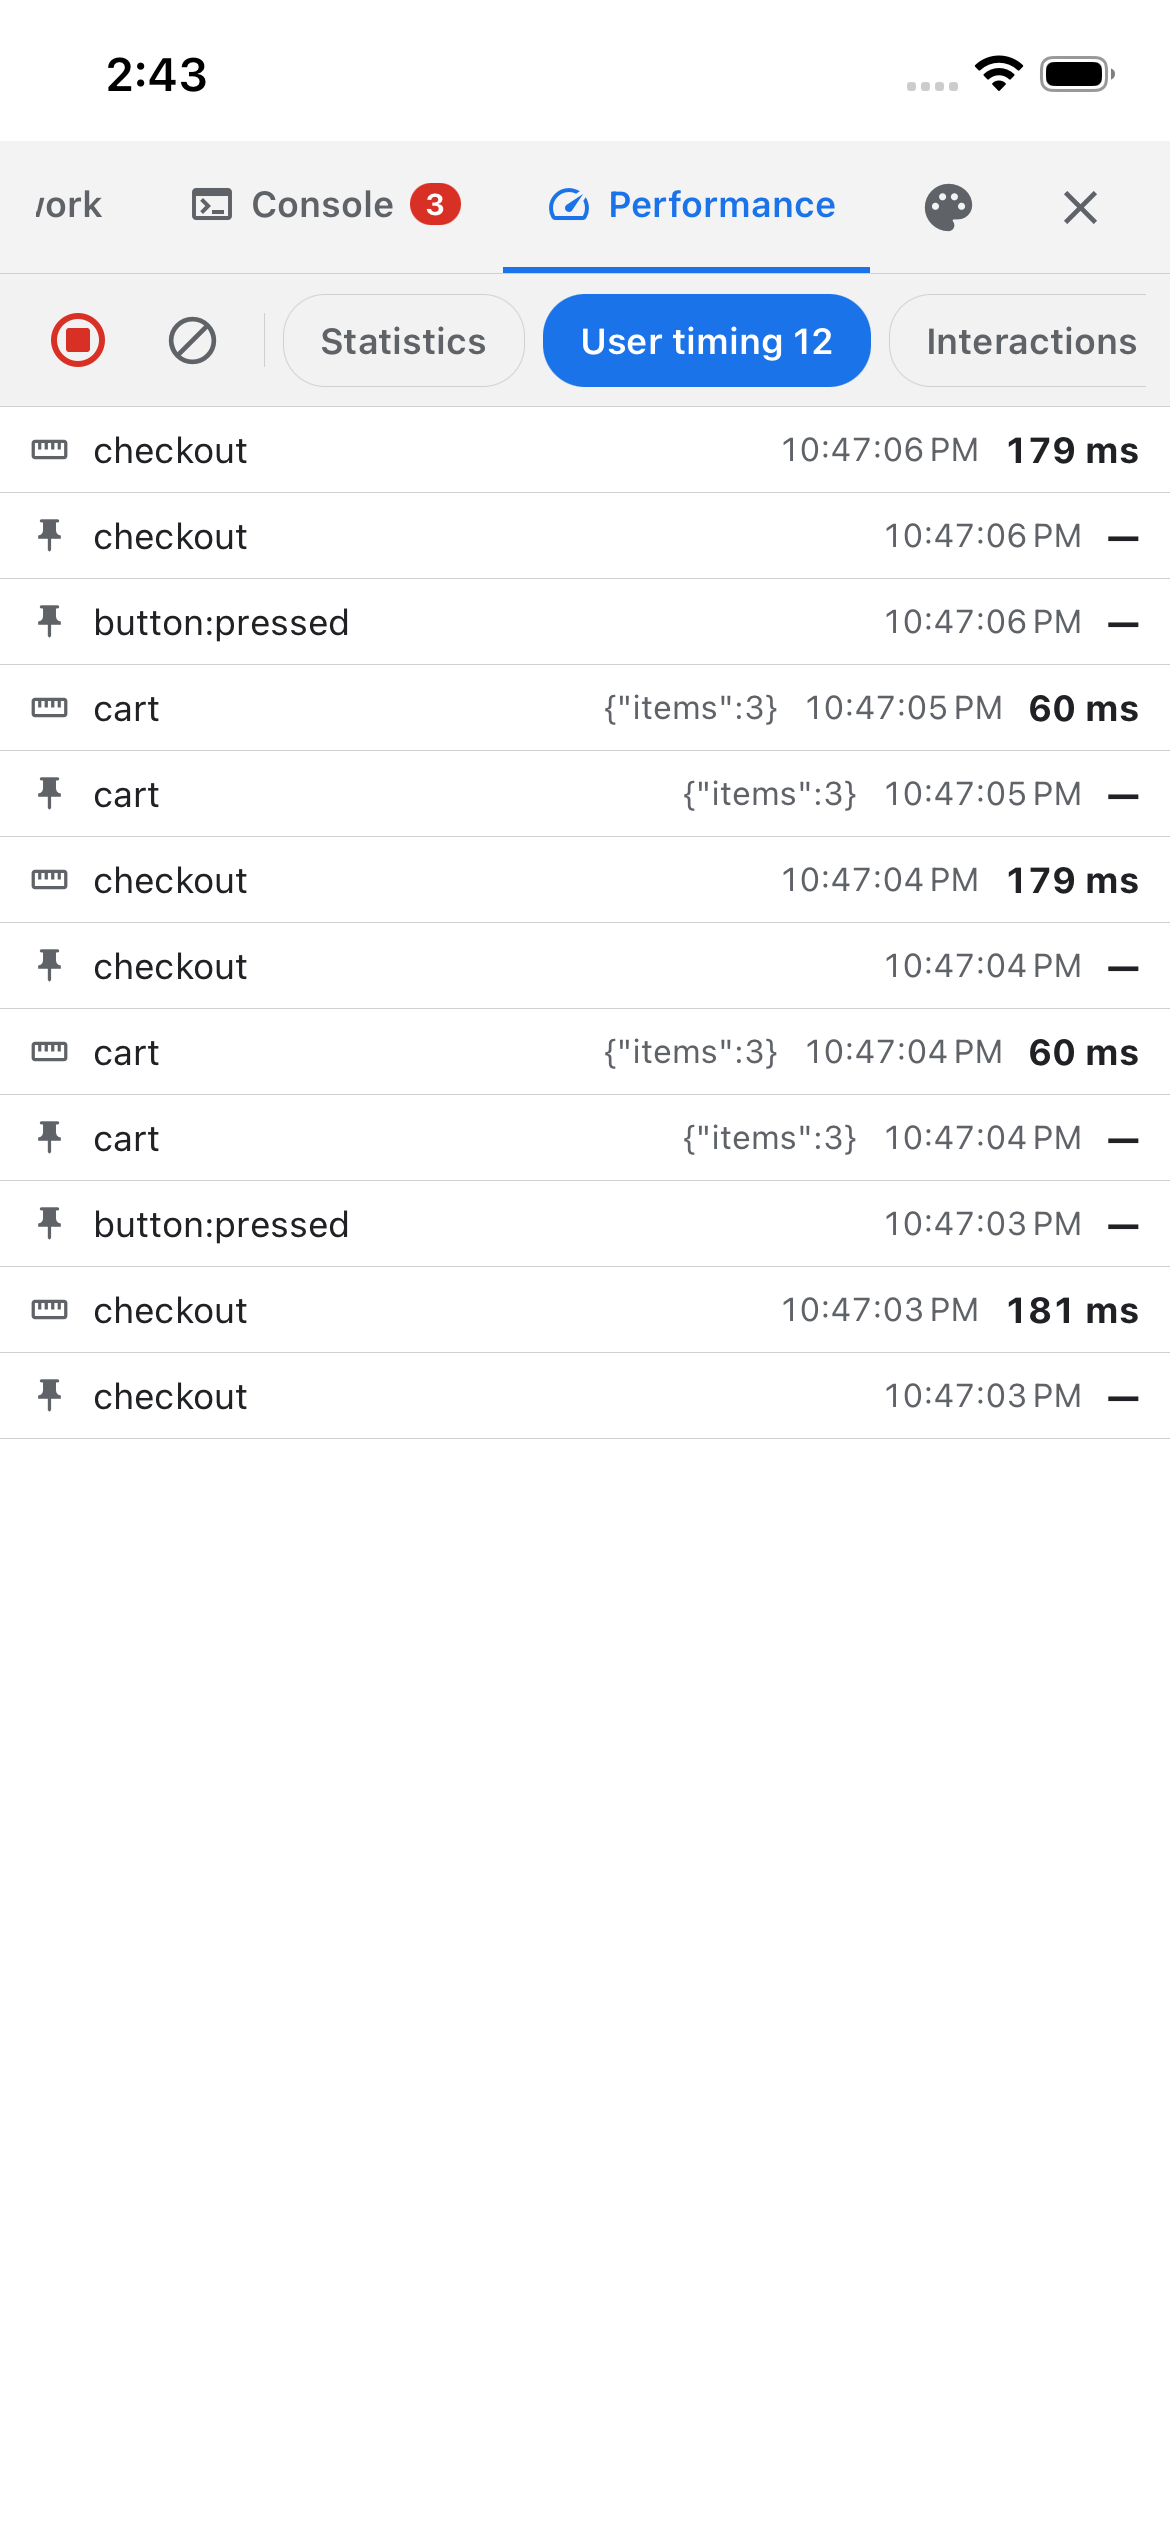
Timings you name yourself, following the W3C User Timing signatures. This is the one metric here that can point at a specific piece of code, so it is the answer to a long task you cannot explain:
devtools.mark('checkout');
await buildCart();
devtools.measure('checkout');
measure(name, startOrOptions?, endMark?) takes a start mark name, or an options object with start,
end, duration and detail, the same shapes the spec defines. Calls are also forwarded to the real
performance.mark and performance.measure, so the entries exist on the platform timeline too.
Nothing is observed from that timeline, which is why React's own internal measures never appear here.
Interactions
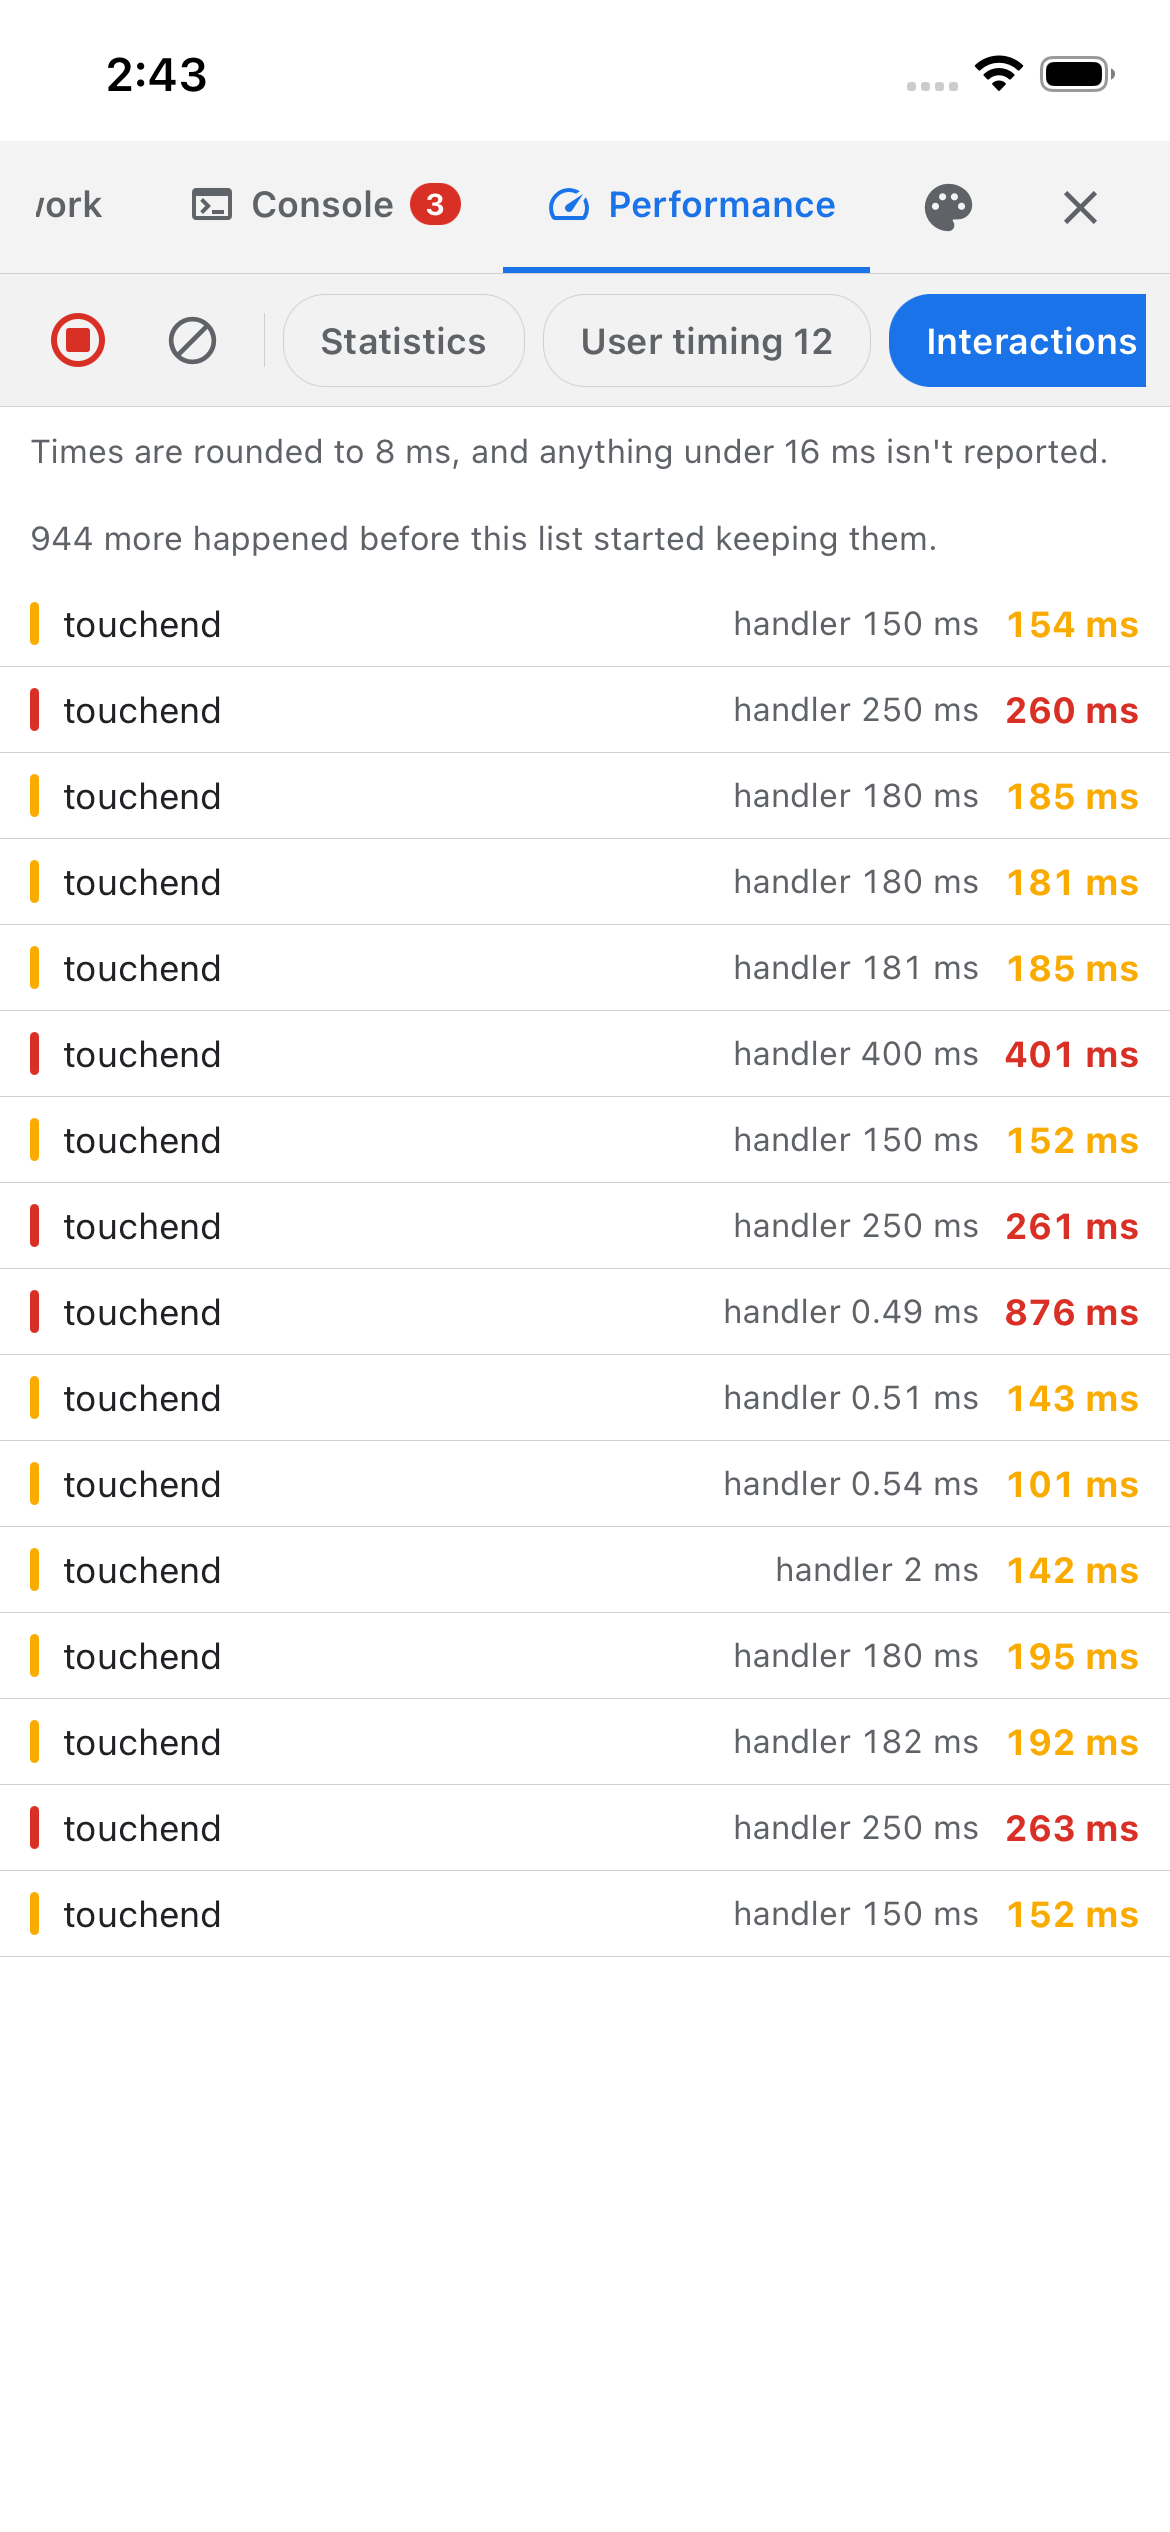
Anything that took longer than 100 ms from the event to the next paint. Each row also shows how long your handler itself held the JS thread: a small handler under a large total means the interaction was stuck behind something else rather than being slow itself.
Durations come rounded to the nearest 8 ms, and nothing under 16 ms is ever reported.
Long tasks
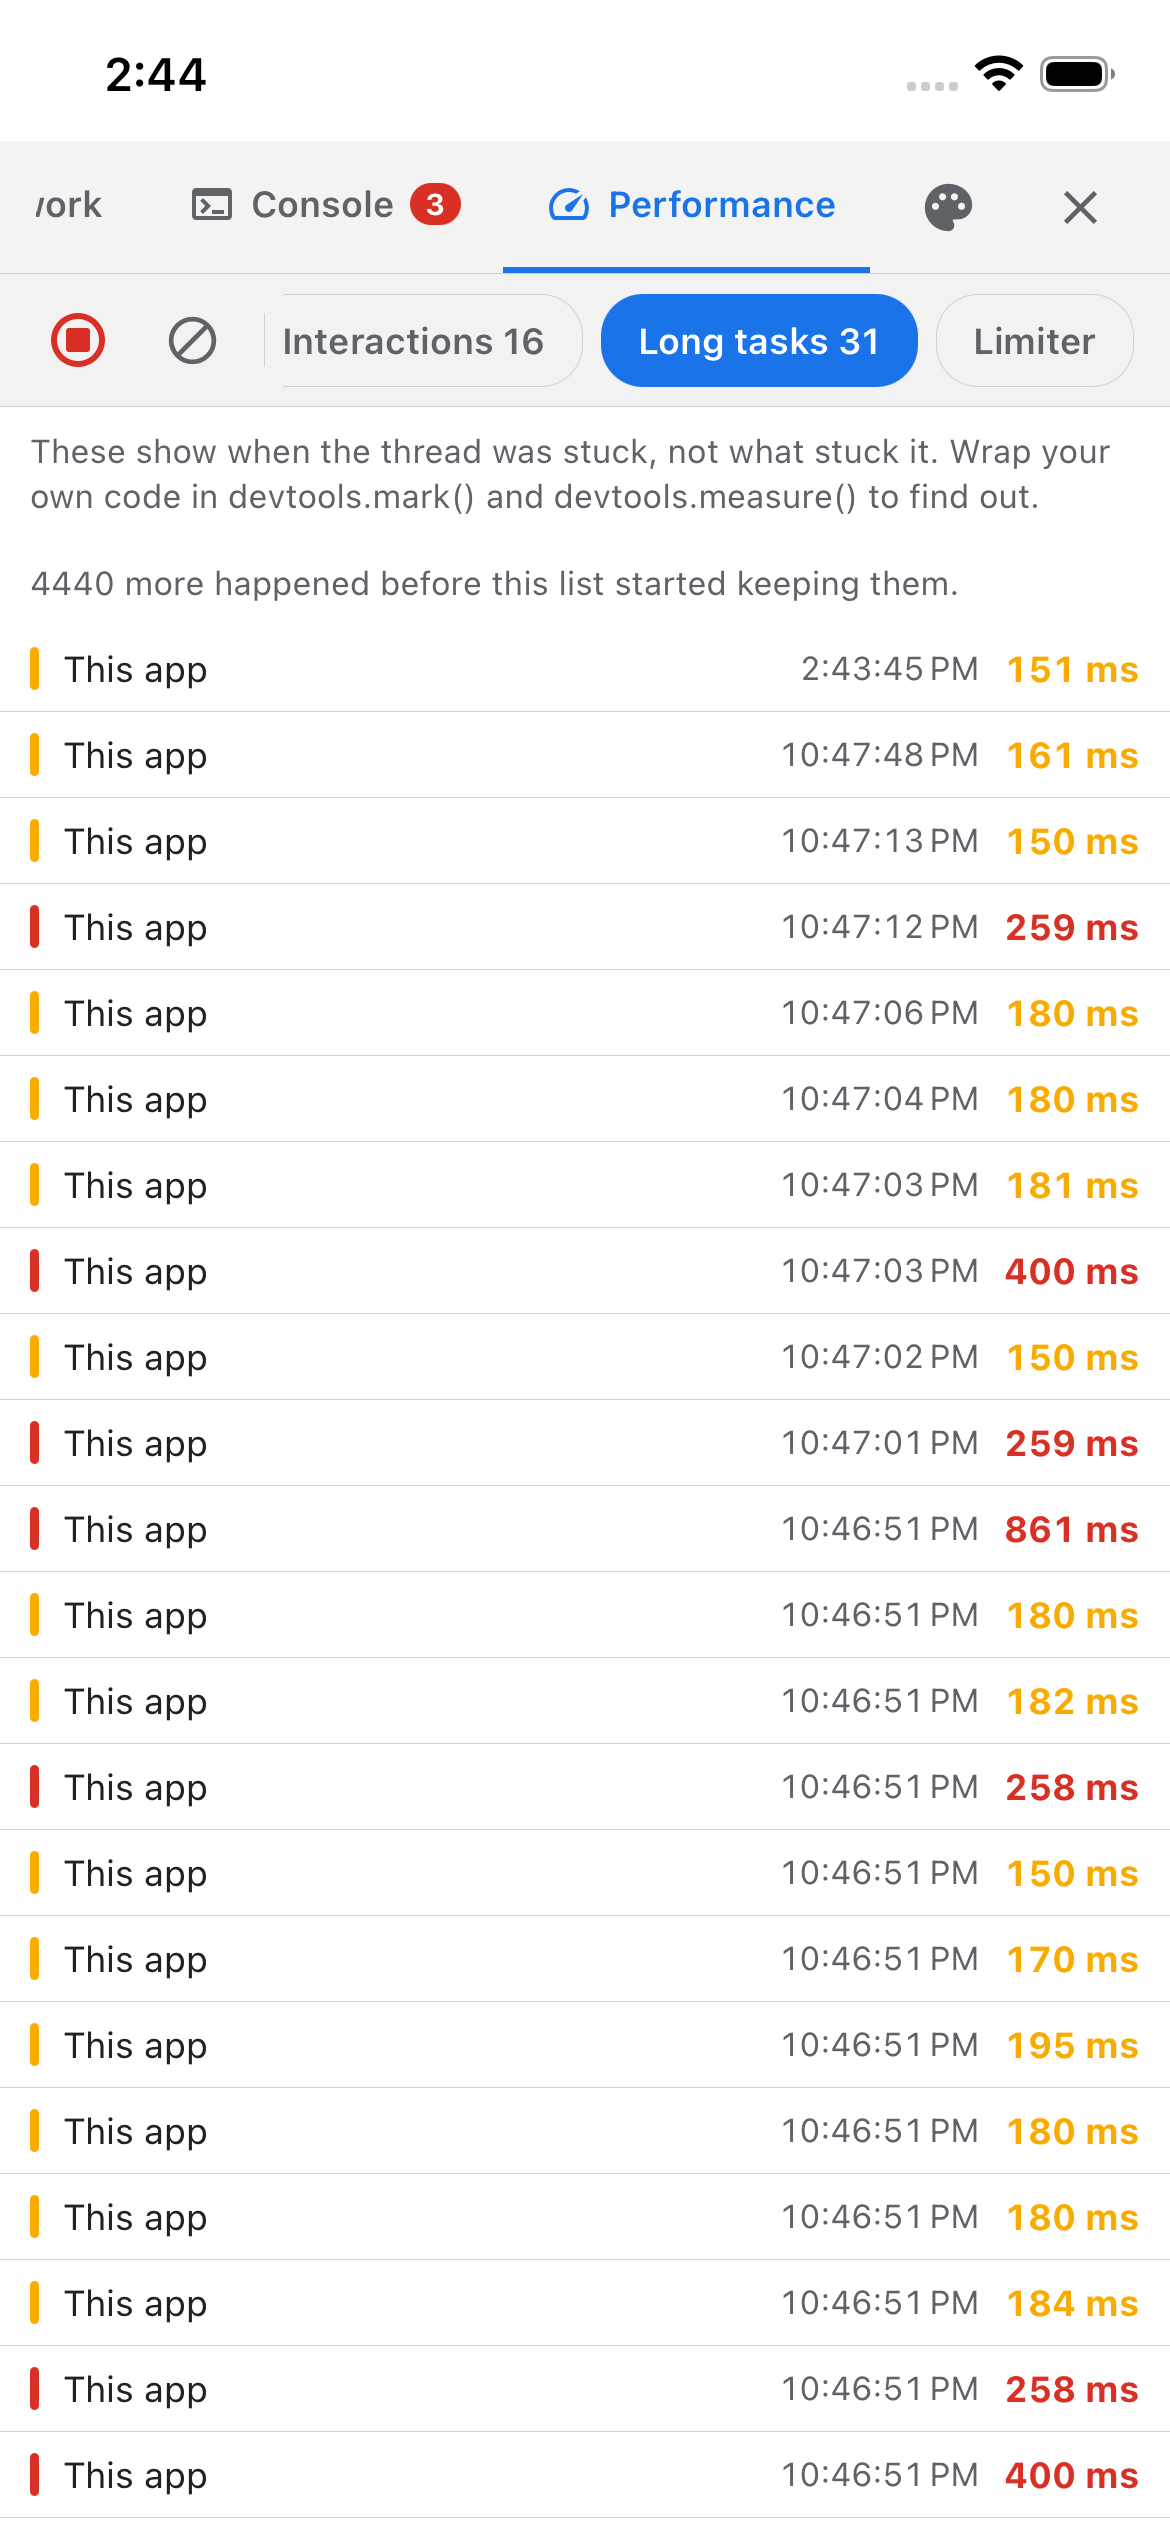
Anything that blocked the JS thread past the threshold (150 ms by default), newest first. A "long task" is one stretch of JavaScript that ran without yielding, so nothing else on that thread could happen meanwhile: no touches, no timers, no animation driven from JS.
At 60 fps a frame is 16.7 ms, so 150 ms is about nine frames lost; past roughly 200 ms it reads as a
freeze. Drop performance.longTaskThresholdMs to 50 if you want to see the smaller ones too.
What it deliberately does not show
This tab is honest about the difference between what it can actually measure and what you probably want to know.
- Storage is Android-only. Nothing here asks for a permission on either platform, and nothing makes
your App Store submission harder, which is why iOS storage is missing.
StatFson Android needs no permission and no manifest entry, but iOS'ssystemFreeSizeis one of Apple's required-reason APIs: no prompt, but it obliges a privacy-manifest declaration at submission, and a library reading it risks pushing that onto every app that embeds it. - No "% of heap limit" gauge. Hermes does not report a heap-size limit, so the denominator would have to be invented.
- No heap snapshots or flame charts. Those come from the CDP
HeapProfilerandProfilerdomains over the inspector socket, driven from outside the app, and a multi-megabyte snapshot is not something you would browse on a phone anyway. - Long tasks name no culprit. React Native's
PerformanceLongTaskTimingreturns a permanently emptyattributionarray — the web API's mechanism for reporting which code was responsible — so a row can tell you a task blocked the thread for 180 ms, but never that it was your list render. Use it to find when to look, then correlate against what the app was doing. - Some metrics depend on the platform. Long tasks and the platform's own startup markers only appear if the native side implements them, which varies by platform and React Native version. When they are missing the tab says so rather than showing zeros.
- Some entries never reach the list. The platform keeps its own buffer and discards entries once it overflows, telling us only how many went missing. When that happens the list says so rather than presenting what survived as the whole picture.